Animate a Math Object With a Trace Path Using Python Manim Library
Learn the basics of manim library to create beautiful animation
Manim is a python library used to create beautiful animation, especially if you want to visualize a mathematical concept. it was invented by 3blue1brown.
Unfortunately, the explanation in the documentation of manim is challenging to grasp especially for beginners. Since understanding the basics of any technology is key to building a mental framework and how you can reinvent the wheel, this article will try to explain some simple basic concepts that will explain some code in the documentation.
I have a pdf copy where I explain all the classes and methods we will use in detail through this link. It simplifies the classes for a beginner to grasp
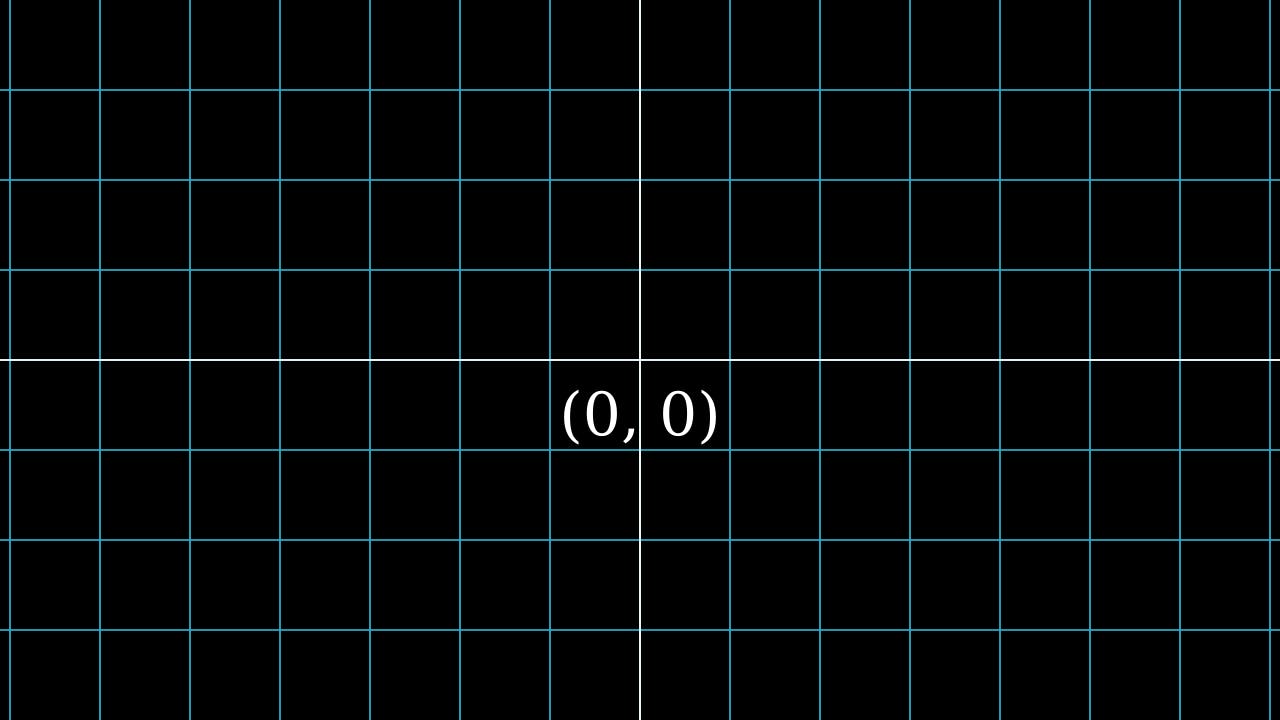
One of the basics is to understand the manim coordinate system.

This is very important when positioning your objects in the scene canvas.
In manim, maths object (mobject) is the basic object that we add to our scene canvas and also animate.
All mobjects are positioned at the centre of the canvas i.e. (0,0) coordinate by default. every cell represents one Munit (manim unit)
When you count the cell in the height, you get 8 Munit and the width will give you around 14.22 Munit. I will be creating a cheat sheet in positioning manim mobjects soon.
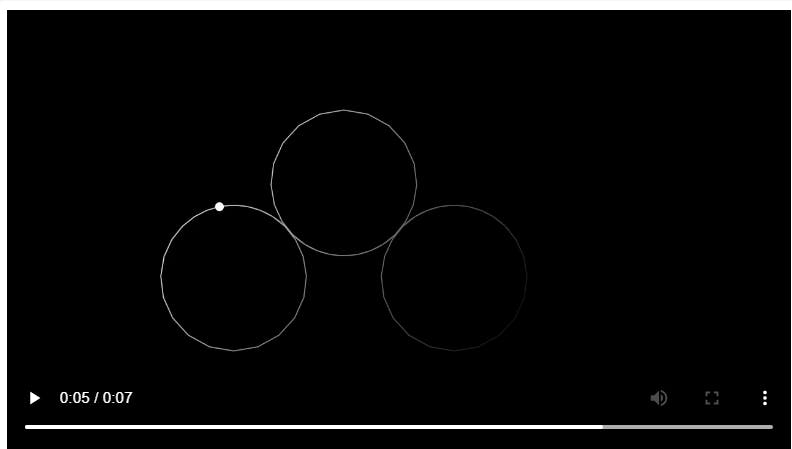
Let's use the TracedPath class from the manim library to animate a moving dot leaving a trace
We will be using google colab to run the code. just run the following code to install the manim library and its dependencies.
!sudo apt update
!sudo apt install libcairo2-dev ffmpeg \
texlive texlive-latex-extra texlive-fonts-extra \
texlive-latex-recommended texlive-science \
tipa libpango1.0-dev
!pip install manim
!pip install IPython — upgrade
The next step is to all classes, methods and functions from the library.
from manim import *
This is the complete code and I will be explaining what each line does use the python comment
# we use this line to run our code in jupyter or colab notebook specifying our quality of rendering
%%manim -qm -v WARNING  TraceDot

# create a class that will inherit from the Scene class
# we create the canvas for displaying our mobject

class TraceDot(Scene):

    # This method is where we implement our animation
    def construct(self):

      # we instantiate our Dot object and move 2 Munit to the right from the origin
      a = Dot(RIGHT * 2)

      # we instantiate our trace object from the tracepath class
      b = TracedPath(a.get_center, dissipating_time=0.9, stroke_opacity=[0, 1])

      # we add our object to the scene canvas
      self.add(a, b)
      # we animate our dot rotating in a circle counterclockwise and shifting from the original position
      #above two Munit left
      self.play(a.animate(path_arc=8).shift(LEFT * 2), run_time=2)

      # we animate our dot rotating in a circle clockwise and shifting two Munit left further
      self.play(a.animate(path_arc=-8 ).shift(LEFT * 2), run_time=2)

      # we animate our dot rotating in a circle counterclockwise and two Munit left further
      self.play(a.animate(path_arc=8 ).shift(LEFT * 2), run_time=2)

      self.wait()

conclusion
Experimenting with python and manim library can be a fun way to learn programming, especially objected-oriented concepts. you will be able to see the result of code through animating mathematical objects(mobjects) and concepts. my next article will be on animating functions and plotting the results.
Originally published at instructables.com.
